|
2002
New Zealand Petroleum Conference Proceedings • 24-27 February 2002
New
Zealand competes on a global stage:
The view from a major oil company.
Abstract
Following
Shell’s successful acquisition of FCE in March 2001, and the programme of Commerce
Commission – mandated divestments thereafter, Shell is now the proud owner of
New Zealand’s broadest EP portfolio, ranging from mature fields like Maui and
Kapuni to rank wildcat acreage.
Our
enthusiasm for New Zealand is a reflection of both the Government’s licensing
terms and fiscal conditions under which we operate, and of the belief that there
is attractive exploration potential remaining in New Zealand, a belief that
is re-inforced by the significant recent exploration successes (e.g. Maari,
Rimu, Pohokura). However, these factors can not be viewed in isolation, but
must stand comparison with the best, on a global stage.
In
order to optimally manage its own global exploration and development expenditure
and to continuously highgrade its portfolio, Shell has instituted a global screening
and ranking system. Individual exploration and development projects are screened
to ensure a consistent treatment of risk and uncertainty in the probabilistic
calculation of volumes, and the translation of these volumes into value estimates.
Assessment and global ranking then follows on the basis of economic return;
time to first production; materiality; and (in the case of certain development
projects) their implications for HSE, asset integrity, or sustainable development.
The
message here is that Shell’s New Zealand opportunities have to compete on a
global stage in order to attract Group funding. The challenges are two-fold:
the first, to our explorers (and to those of the New Zealand exploration community
who would like to bring Shell on board as a partner) is to generate significant
exploration prospects with acceptable risk profiles and fast, low-cost development
options. The second challenge is to the New Zealand Government to ensure that
contractual terms and fiscal conditions remain globally and geologically competitive,
i.e.
•
there is a global trend towards relaxation of terms for deep water and frontier
acreage
•
whilst New Zealand is expected to yield attractive small-moderate sized discoveries,
it is not expected to yield giant discoveries, on which major oil companies
depend to recharge their reserves inventories.
The
consequence of the above is that some elements of Shell’s portfolio in New Zealand
will probably not attract funding. However, we undertake that, wherever practicable,
we will re-cycle these opportunities to the rest of the New Zealand EP community,
in order to help sustain the currently high levels of domestic exploration activity,
upon which New Zealand’s continued hydrocarbon self-sufficiency depends.
Introduction
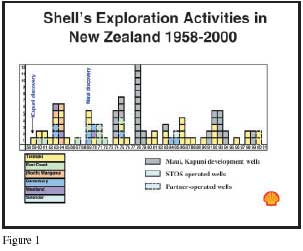
Shell
first started exploring in New Zealand in 1911; serious exploration began in
the late 1930s; and the formation of the Shell, BP, Todd Joint Venture in 1955
(now Shell Todd JV) provided the framework within which Shell’s activities have
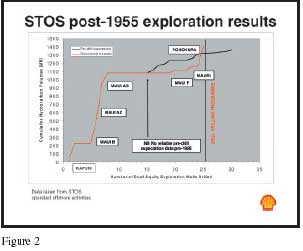
remained continuously active up to the present (Fig. 1). Reward for this endeavour
has come (Fig. 2) with the Kapuni discovery in 1959 (on stream in 1969), followed
by the Maui A/B gas discovery in 1969 (on stream in 1979) and the Maui B deeper
pool F sand oil discovery in 1993 (on stream in 1996). More recently, a renewed
focus on New Zealand by 2 2002 New Zealand Petroleum Conference Proceedings
Shell has borne fruit with the success of Maari in 1998 and our participation
in the Pohokura discovery in 2000, followed by the successful acquisition of
FCE in March 2001.
Shell’s
current enthusiasm for New Zealand is a reflection of both the Government’s
license terms and fiscal conditions under which we operate, and of the belief
we have that there is attractive exploration potential remaining in New Zealand.
The
global stage
This
current favourable view of New Zealand must be considered, however, in the context
of the evolving perceptions of, and changing conditions in, the global oil industry.
Principal among these are:
•
A perception that oil prices will remain moderate at best (hovering around US$
20 /barrel) in the medium term.
• The development of technology permitting exploration and development of oil
and gas in progressively deeper waters has opened up extensive rich basins for
exploration.
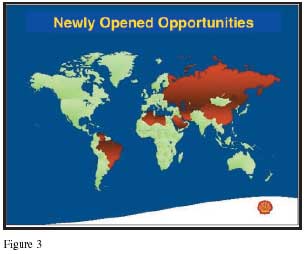
• The progressive opening up over the last decade or so of many countries hitherto
closed to the international oil companies (Fig. 3), such as the CIS states and
the Caspian Basin; the Middle East Major Resource Holders; and those other countries
where National Oil Company monopolies have been eroded (e.g. Brazil, Mexico,
Venezuela, and China).
This
evolving global scene is creating a situation for both Shell and the New Zealand
authorities which is considerably more challenging than in the past.
Shell’s
response to new global order
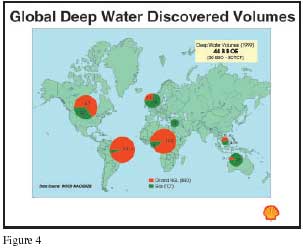
Attractive,
high volume potential basins have become increasingly expensive to access as
ongoing drilling reveals the quality of the basins (e.g. Angola, the Caspian,
Gulf of Mexico, Brazil (Fig. 4)), and competitors anxious to enter or consolidate
their positions force up signature bonuses and other entry costs. High work
commitments in these basins, coupled with a steadily increasing number of blocks
under license, and a limited fleet of deep water rigs, will result in further
significant cost escalations.
This
evolution in the global EP environment has forced Shell to radically re-assess
the way in which it approaches its upstream business, in order to prevent a
ballooning of exploration costs and commitments; to ensure that a portfolio
built during times of high oil price (pre-1998, and mid 1999 to late 2001) can
be managed during periods of low oil price (e.g 1998-mid-1999, and late 2001);
and to ensure that Shell EP will continue to deliver the expected returns to
the Shell Group ($3 billion/yr, normalized at a $16/bbl oil price).
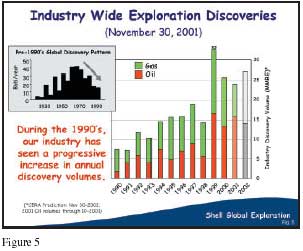
As
an indication of the magnitude of the task facing Shell explorers, we need to
discover and book as reserves some 1.4 billion boe/yr just to replace our production,
and this against a backdrop of steadily decreasing global discovery volumes,
which averaged 10 billion boe/yr in the early 1990s compared to 40 billion boe/yr
in the 1960s (Fig. 5 - left). However, a notable feature of the last half-decade
is the number of giant oil and gas discoveries which have been made (over 40
discoveries > 500 MMBOE since 1995). These discoveries are starting to turn
the discovery curve around (Fig. 5 - right) and are driving the major oil companies
to those basins (e.g. the Atlantic Golden Triangle (Gulf of Mexico, West Africa,
Brazil) and the Caspian) capable of yielding such material discoveries.
A
parallel drive by the majors into development projects in the Major Resource
Holders of the Middle East is intended to provide robustness to low oil prices,
and a hoped-for access to large-volume exploration opportunities in the longer
term. Pursuit of these projects is, however, demanding of both staff and funding.
Shell’s
exploration expenditure allocation system
To
manage this situation, Shell has developed a system for the global ranking of
all exploration and production projects, to ensure that EP budgets remain tightly
controlled; to ensure that it is the best projects in our global portfolio which
attract available funding; and to ensure that Shell’s global exploration strategies
are ‘hard-wired’ into the Expex allocation process. I will illustrate our philosophy
with reference to exploration, but we have a similar system for development
projects.
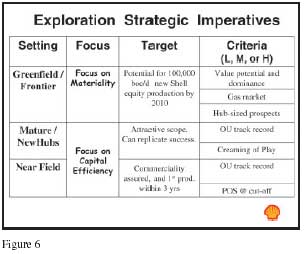
Firstly
we divide our exploration projects and plays into three strategic categories
(Fig. 6), which I will illustrate by reference to New Zealand examples:
1.
Greenfield and frontier exploration (e.g. Taranaki Deep Water, and the Haast
Basin, offshore South Island) where our emphasis is on materiality; the existence
of hub-sized prospects; the potential to control the play; and where, if gas
is the target, it should have a clear high-volume market access or potential.
2. New hubs in mature basins (e.g. Pohokura, Kaheru), where the emphasis is
on capital efficiency, in basins or plays that still have significant remaining
potential and where we can replicate prior success.
3. Near field exploration (e.g. Ngarewa – Kapuni PML Mt. Messenger) where the
emphasis is again on capital efficiency, and where a high probability of success
(POS) and early hook-up and monetization is essential.
For
each of these categories we distinguish low, medium, and high criteria.
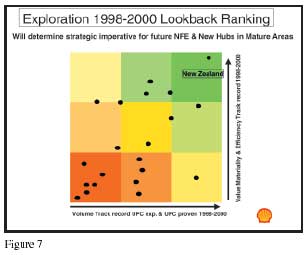
In
both of the last two categories, the ranking is completed with reference to
the Operating Unit’s track record in delivering value over the previous 3 years,
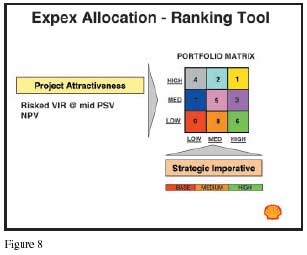
and here STOS has done extremely well (Fig. 7). 2002 New Zealand Petroleum Conference
Proceedings This ranking by type of exploration and strategic criteria is entered
on the horizontal axis of a 3x3 matrix (Fig. 8). The vertical axis represents
Economic Attractiveness, defined by a combination of the project Risked Value-to-Investment
Ratio (VIR) and Success Case NPV. This matrix thereby gives us a ranking of
our best, or most strategic, projects, and it is these, and only these, which
receive funding to proceed, or in some cases receive funding conditional upon
VIR enhancement (e.g. by farming out for carry).
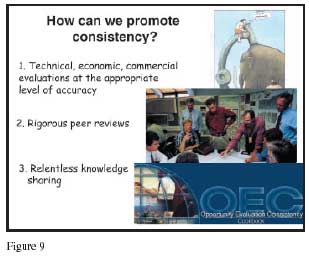
For
this global ranking system to work, however, it is essential that management
has the confidence that all exploration projects have been evaluated in a globally
objective and consistent manner, such that a 20% POS (Probability of Success)
in one basin is truly equivalent to a 20% POS in another basin, and that the
risk and uncertainty profiles of different prospects are evaluated in a manner
that is consistent with prior experience in that basin or in analogue basins
(e.g. in a Tertiary delta setting, faults with throws of <30m will seal 100%
of the time). This global consistency is assured (Fig. 9) by the use of the
same prospect evaluation programs in all Operating Units; by a system of independent
peer reviews in the run-up to each year’s Expex ranking exercise; and by a web-based
global network from which explorers can glean opportunity evaluation best practise
from other operating units and from peer reviews around the world.
Results
of 2001 expex allocation
A
summary of the outcome of last year’s expex exercise is instructive, in that
it highlights the competition for funding within Shell’s portfolio.
We
received a total submission of projects for implementation in 2002 totalling
over US$ 2 billion, of which $ 1 billion was approved as a base plan with a
further $ 250 million held back, to be competed for by emerging options during
the course of 2002.
In
other words, >35% of our projects will not be funded – and these are not bad
projects: they all return twice the cost of capital (i.e. IRR > 15%) or better.
It is just that they are not as good as the best in our portfolio of opportunities.
Of
the $1 billion approved, over 40% is going to deep water projects – further
testimony to the attractiveness of many of these basins.
Impact
of New Global Order on New Zealand
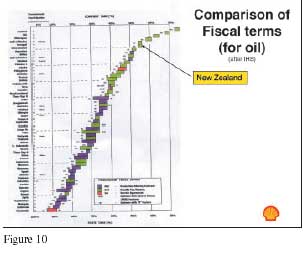
The
Crown Minerals and Ministry of Economic Development have done an excellent job
to date in keeping New Zealand near the top of the league table of World Exploration
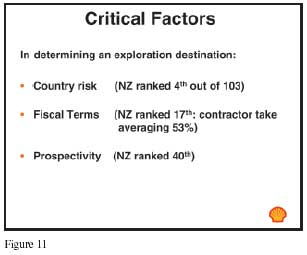
Attractiveness (Fig. 10). New Zealand’s political stability and system transparency
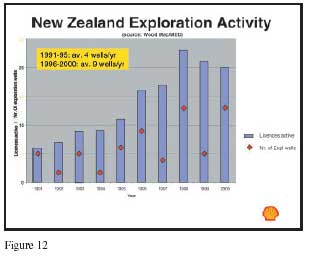
are second-to-none, and fiscal terms are attractive (Fig. 11), whilst acreage
management has been first class – the AFO system (instituted in 1995) has resulted
in a significant increase in the number of blocks under license, and a concomitant
increase in the number of exploration wells drilled each year (Fig.12).
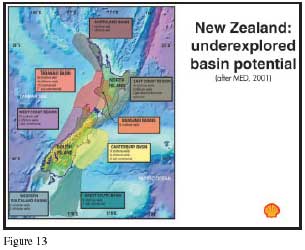
However,
political stability and terms are only two factors in the attractiveness equation
– the third is geological potential. I agree with Roger Gregg (MED presentation
to the East Australian Basins Conference, Melbourne, Nov. 2001) that New Zealand’s
basins (Fig. 13) are under-explored, and that many have proven hydrocarbon systems:
but (and here our paths diverge) I believe the likelihood is that none of these
basins will be better than Taranaki – where despite >100 wildcats only one giant
field (Maui) has been found.
Now
consider this perception in the light of the following:
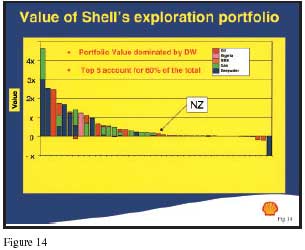
•
the increasing access being enjoyed by the International Oil Companies to high
potential acreage such as the ‘Golden Triangle’ Deep Water, and the Caspian;
the resultant increase in the share of total portfolio value which such as these
comprise, and how they dwarf New Zealand’s contribution (Fig. 14)
• the disadvantage of New Zealand’s isolation, which results in significant
mob/demob costs for offshore services and resources
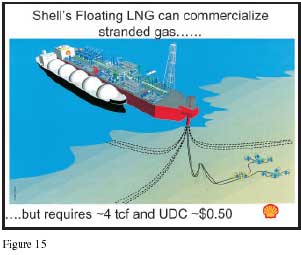
• the fact that the majority of New Zealand’s frontier acreage is located offshore
South Island – which by contrast with North Island has a small population, and
a very limited market and infra-structure for gas. With this in mind, it should
be noted that significant volumes (over 3 tcf reserves) and low unit development
costs (~US$ 0.50 / mcf) are required before stranded gas can be commercialised
via such processes as gas-to-liquids or floating LNG (Fig. 15)
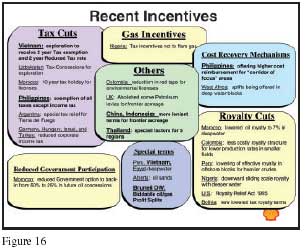
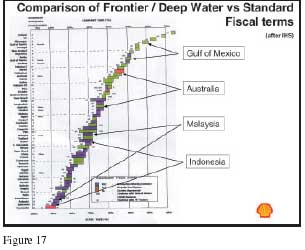
• the increasing competition from other countries – some are blessed with high
volume potential; the others, less blessed, are improving terms and conditions,
especially for Frontier and Deep Water acreage (Figs. 16, 17) to ensure that
they can continue to attract EP investment.
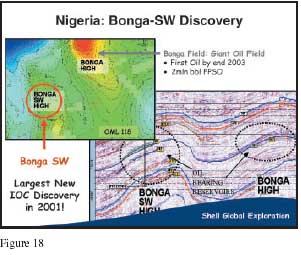
I
have already referred to the attractiveness of deep water basins. What is it
that makes them so attractive? Not only is the structural setting conducive
to the formation of large, tectonically simple, structural traps, and hence
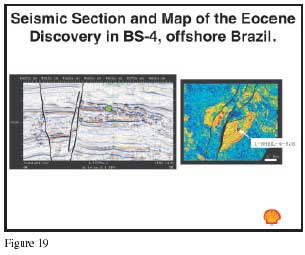
giant hydrocarbon discoveries (Fig. 18), but also the nature of the sands and
shales in these Neogene deltas is such that sophisticated Direct Hydrocarbon
Indicator technology can be far more confidently applied (Fig. 19) than in the
older, denser sequences of New Zealand’s rifted basins. This enhanced confidence
translates directly into larger risked volumes in the pre-drill portfolio.
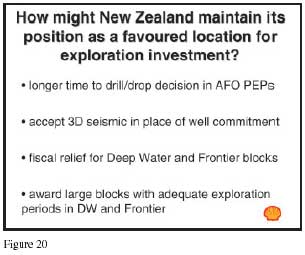
All
of the above contributes to an increasingly competitive global stage for New
Zealand. To avoid undue erosion of New Zealand’s competitive position, I suggest
it may be timely to re-evaluate some of the New Zealand terms and conditions
(Fig. 20). For instance, in AFO PEPs, an increase in the length of time to a
drill-or-drop decision point is suggested, and acceptance of 3D seismic in lieu
of a well in these blocks, would be an appropriate recognition of the structural
complexity of many of the new plays being currently pursued or visualised. In
addition, a recognition that the emerging deep water and other frontier basins
(e.g. Taranaki deep water, the Great South Basin, the Haast Basin) will need
fiscal relief if they are to compete with other frontier and deep water opportunities
in, for example, the Atlantic basins. In addition, especially in Frontier basins,
the high cost of deep water operations coupled with New Zealand’s remoteness
and severe met-ocean conditions, will require the award of large blocks and
generous exploration periods, so that operators have the chance and the time
to pursue multiple plays in the search for material success.
Implications
for Shell’s portfolio in New Zealand
Despite
the fact that the value of Shell’s New Zealand exploration opportunities comprises
only a tiny part of the total value of Shell’s global portfolio (Fig. 14), Shell
Petroleum Mining has been relatively successful in attracting expex funding
over the last 2 years, reflecting not only the Author Pete Jeans has worked
for Shell for 28 years. From 1999-2001, he held the position of Regional Business
Advisor for New Zealand in the East Asia and Australasia Regional Directorate
in the Hague. He has recently transferred to the job of Regional Geological
Consultant for the Middle East and CIS regions in Rijswijk. Pete has a Ph.D
in Geology from Birmingham University, England; is a member of the AAPG; a Fellow
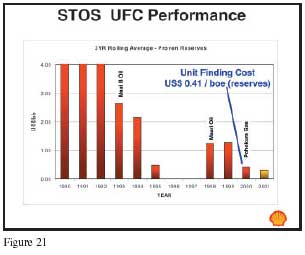
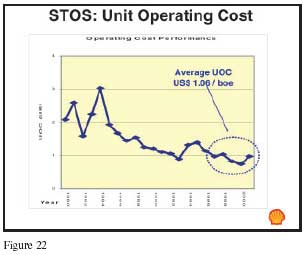
of the Geological Society; and is on the Editorial Board of GeoArabia. fact
that the best New Zealand projects (e.g. Kaheru, Pohokura, the Haast Basin)
rank highly in Shell’s portfolio, but also that STOS/SPM performance in delivering
value to the Shell Group in terms of unit finding cost (Fig. 21), and continuous
unit operating cost reduction (Fig. 22) has been first class.
However,
there will undoubtedly be several Shell New Zealand exploration projects which
fail to reach the high hurdle required for Shell funding, but which in themselves
will still be viable projects with (in a New Zealand context) attractive volume
and economic potential. As different members of the New Zealand EP community
will have different technical and commercial perspectives on any acreage, as
well as different investment criteria, the ‘recycling’ of these opportunities
to our peers and competitors should result in the opportunity for attractive
win-win deals for both parties. This should go some way towards sustaining the
current high levels of exploration activity upon which so much of New Zealand’s
future prosperity will hinge.
|